
Trade Analytics
Trade analytics built around the trades you actually took.
Turn your completed trades into patterns you can use. TradersLink connects your overall performance to the timing, tickers, price ranges, position sizes, holding times, and individual trades behind the results.
Start with the numbers. Follow what stands out. Keep investigating until you reach the trades and executions that produced it.
Sign up freeNo credit card required.
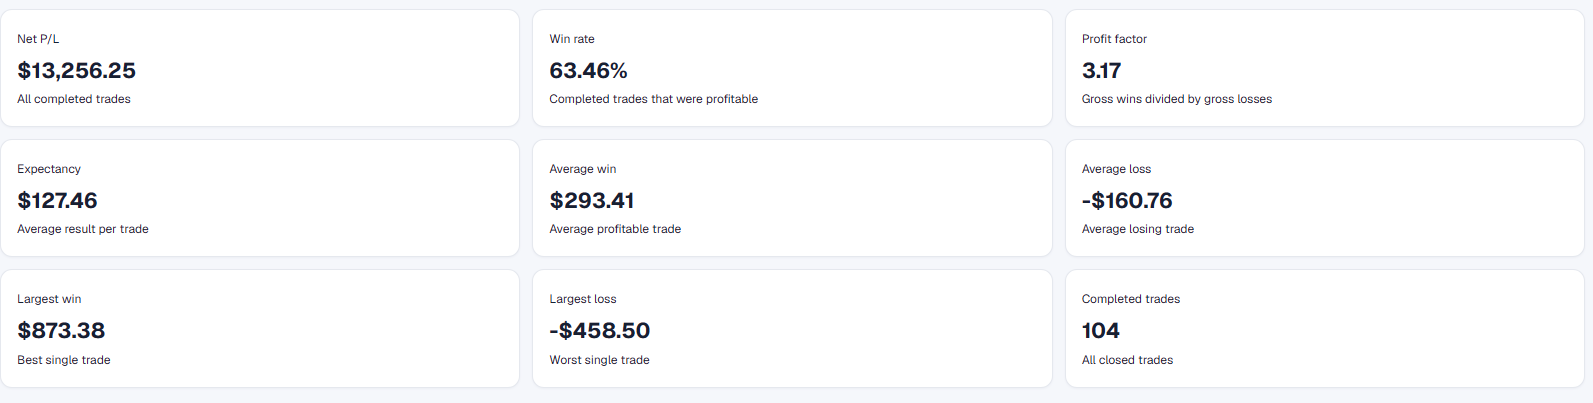
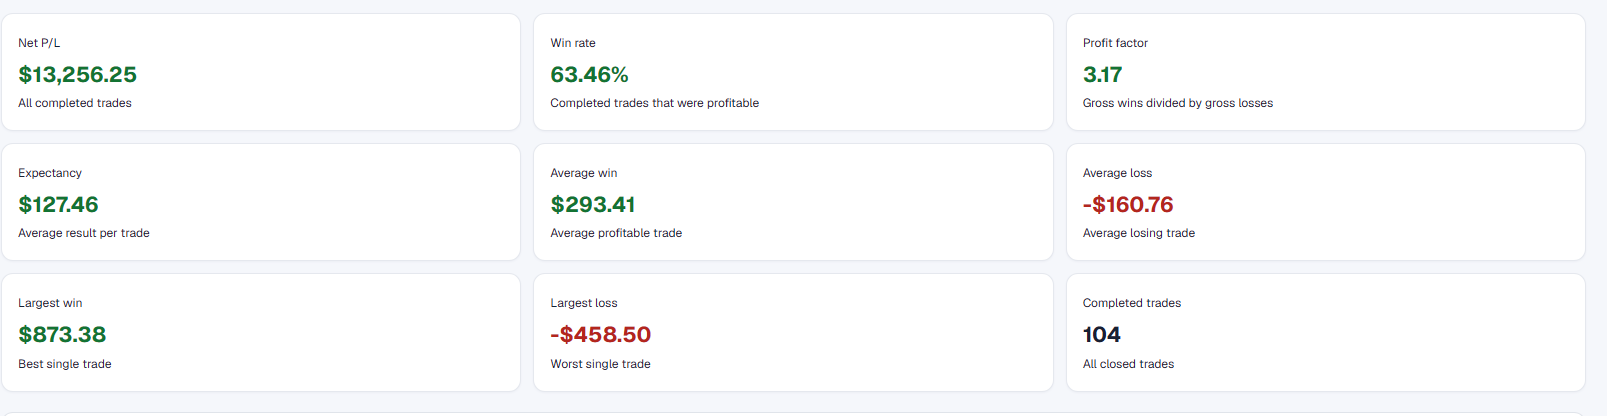
Net P/L $13,256.25. Win rate 63.46%. Profit factor 3.17. Trade Explorer connects those results to completed trades, while Trade Timing groups them by day of week.

Performance Overview
Start with the complete picture.
Net P/L tells you where the selected period ended. It does not tell you how the result was produced.
A strong win rate can still produce poor results when losses are too large. A lower win rate can work when winners consistently outweigh losers. Profit factor, expectancy, average wins, average losses, and trade count put the headline result into context.
A profitable period can still contain a weakness worth investigating. A losing period can still contain a ticker, time range, or trade type that worked.
One result starts the question. The other metrics help explain it.
Performance Overview includes Net P/L, win rate, profit factor, expectancy, average win, average loss, largest win, largest loss, and completed trades.
Trade Explorer
Explore your trading from every angle.
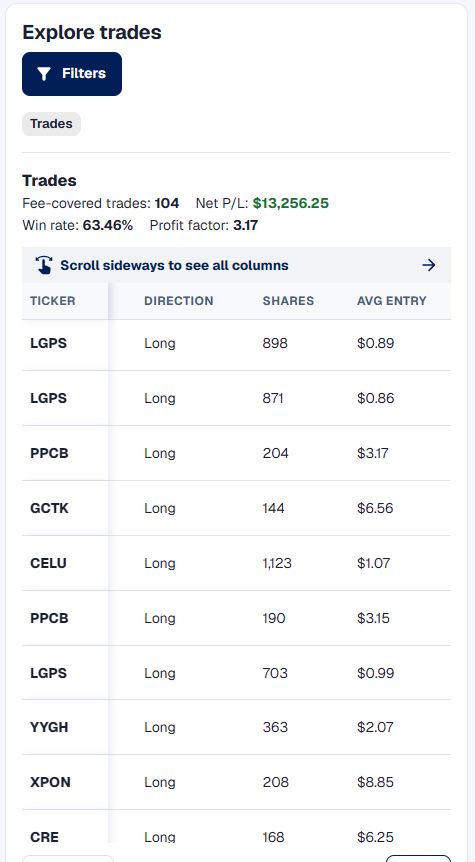
Most trading dashboards give you one fixed view. Trade Explorer lets you reorganize the same completed trades around the question you are trying to answer.
Review losing trades in one ticker. Find every trade entered after a certain time. Compare larger positions with smaller ones, or isolate the trades from a difficult week.
Find the trades behind the result.
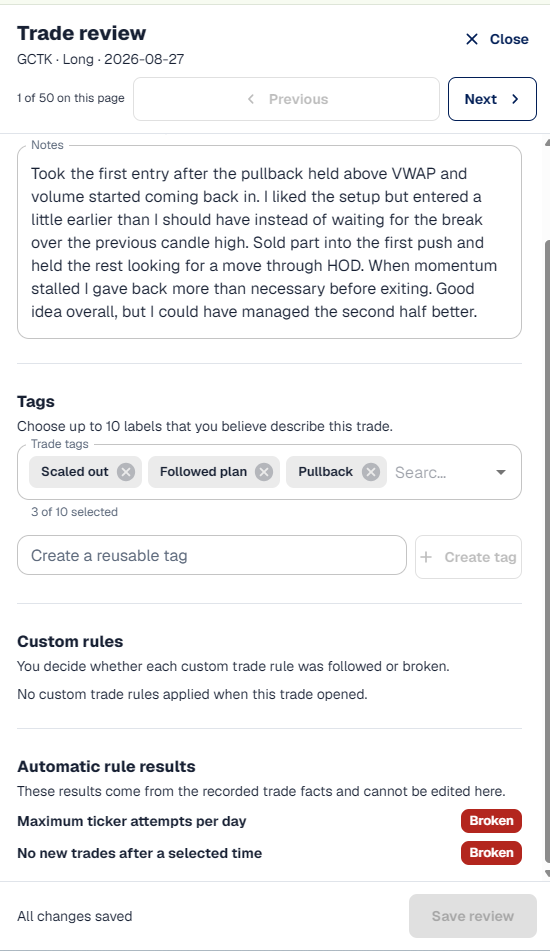
Filter by date, ticker, direction, result, and trade type. Sort around the characteristic you are studying, then open a completed trade without losing the context of the analysis.
- Entries & exits
- Executions
- Trade notes
- Trade Tags
- Trading rules
- Analyzer chart
Trade Timing
See when your trading has worked best.
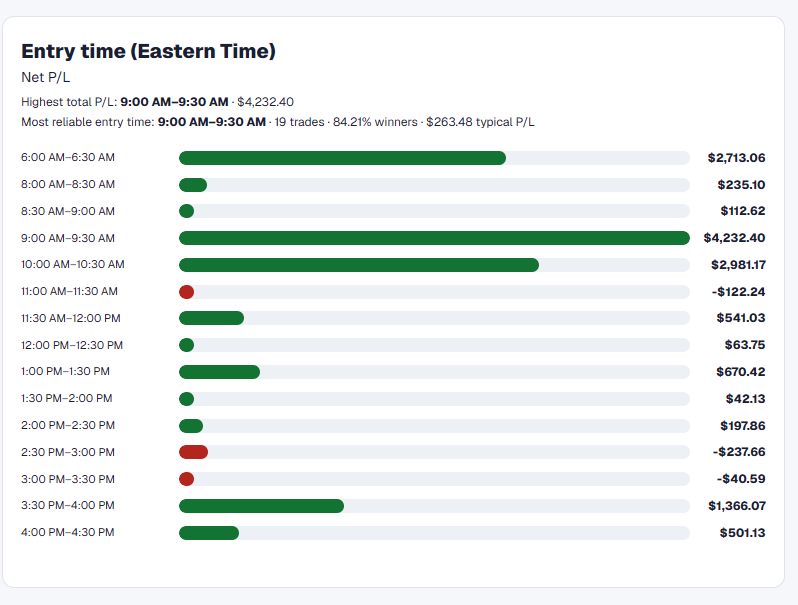
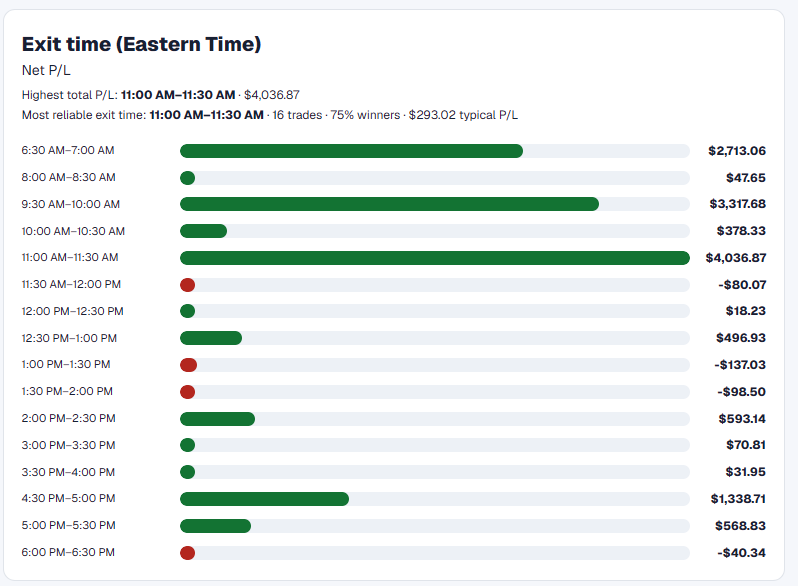
Break completed trades down by entry time, exit time, day of week, and trading session. See whether your results have been stronger near the open or later in the day, and how premarket compares with regular and after-hours trading.
Compare Net P/L, average P/L, win rate, and trade count together. The time with the highest total may contain one large winner; a repeated result across more trades can tell a more useful story.

Trade Breakdown
Find the trade conditions behind your results.
Break completed trades down by entry price, entry size, maximum position, holding time, direction, and day or multi-day trades.
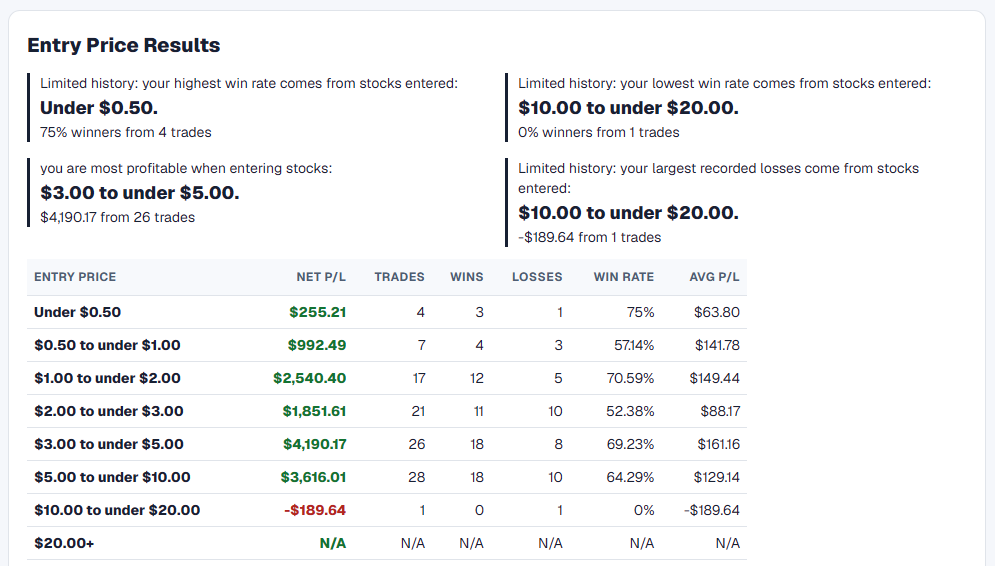
For small-cap traders, entry price can change the character of a trade. A sub-dollar stock, a $3 momentum name, and a higher-priced stock can bring different spreads, volatility, liquidity, and sizing decisions. See which price ranges have been most profitable and which have repeatedly worked against you.
Then check whether the result changes as position size grows or holding time lengthens. More dollar profit does not always mean stronger trade quality.


Ticker Analytics
Find the tickers that have helped—or hurt—your trading.
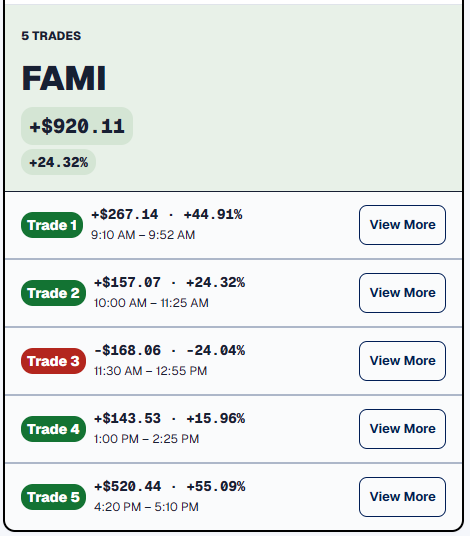
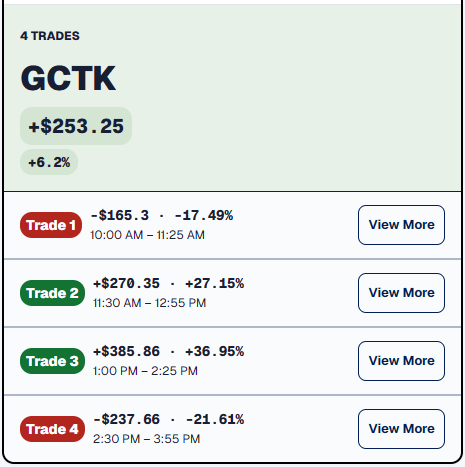
Compare completed results symbol by symbol. Search the ticker list and sort it around the metric you want to investigate.
A ticker near the top may reflect one exceptional trade or a result repeated across several trading days. A ticker that keeps producing losses may point to price, timing, sizing, or trade-management decisions worth reviewing.
Open the ticker to see the completed trades behind the number, including executions, Trade Tags, notes, trading rules, and saved trade analysis.
Compare Trades
Test the patterns you think you see.
Build two to four independently filtered groups of completed trades and place their results side by side.
Compare one week with another, one ticker with another, profitable trades with losing trades, morning entries with later entries, or smaller positions with larger ones. Turn a trading suspicion into something you can measure.
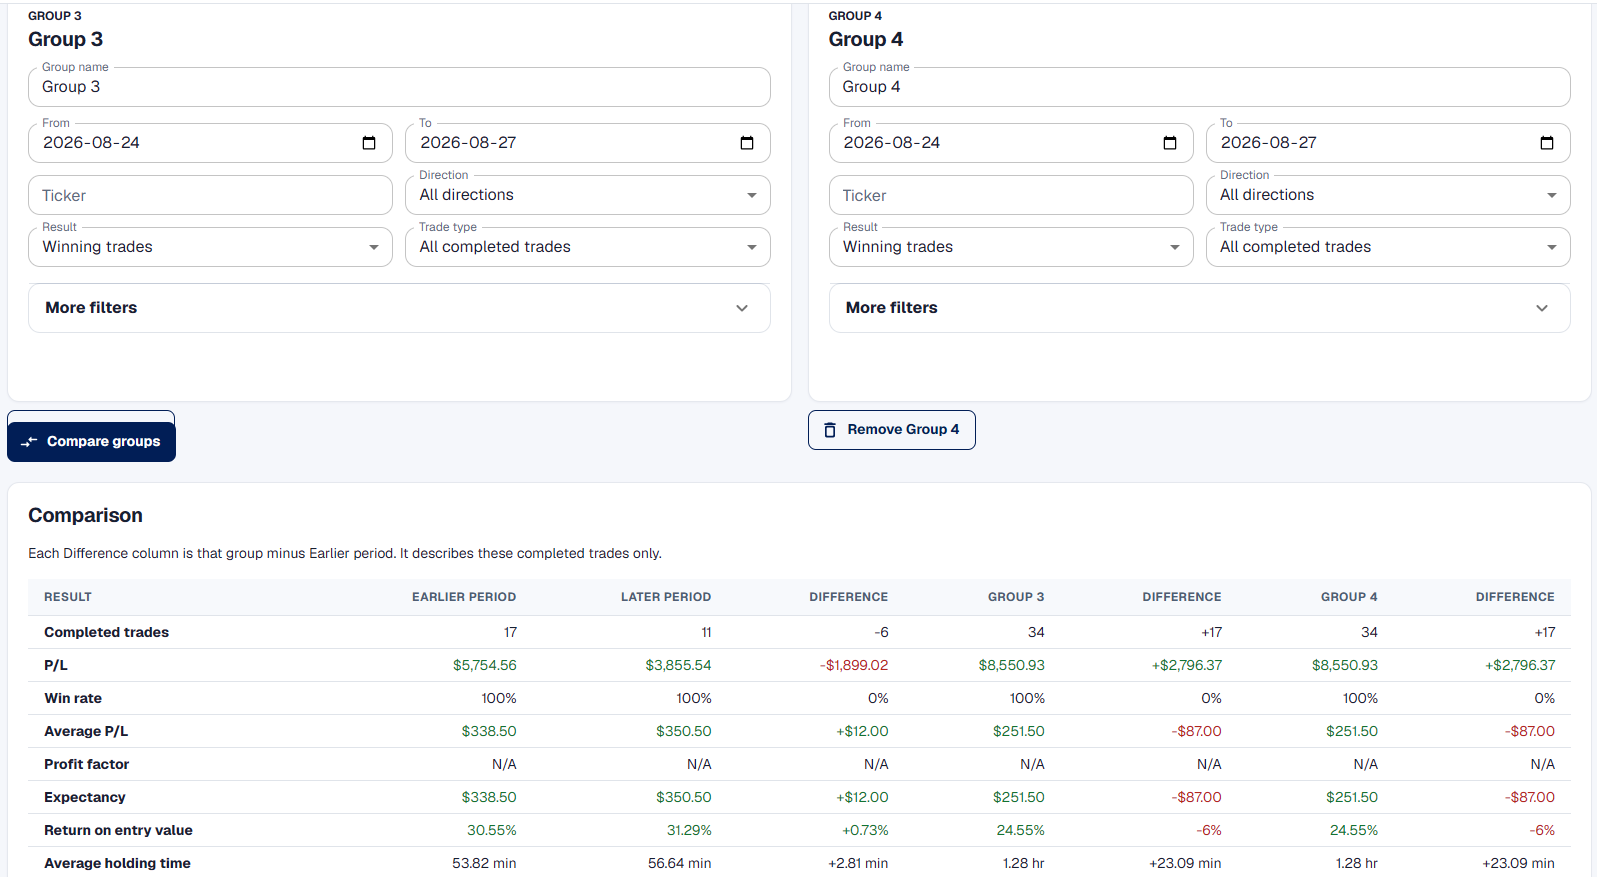
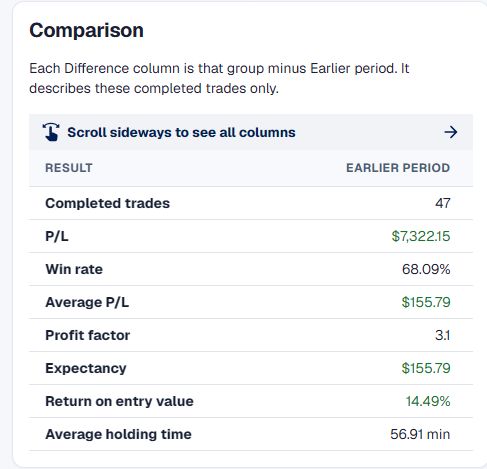
See the completed trades, Net P/L, win rate, average P/L, profit factor, expectancy, return on entry value, average holding time, and the difference between groups.
From Pattern to Trade
Follow every pattern back to the trades behind it.
Move from the number that caught your attention to the trades, executions, and decisions that produced it.
-
1
Notice what stands out.
Start with overall performance or one prepared Analytics view.
-
2
Narrow the result.
Isolate a time, ticker, price range, holding time, or position size.
-
3
Find the exact trades.
Use Trade Explorer to open the completed trades responsible for the result.
-
4
Review what happened.
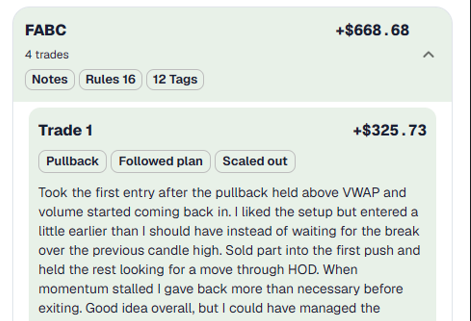
Inspect entries, exits, executions, notes, Trade Tags, trading rules, and saved analysis.
-
5
Compare when needed.
Build selected groups and see whether the difference remains visible side by side.
Go Deeper
Go beyond the numbers.
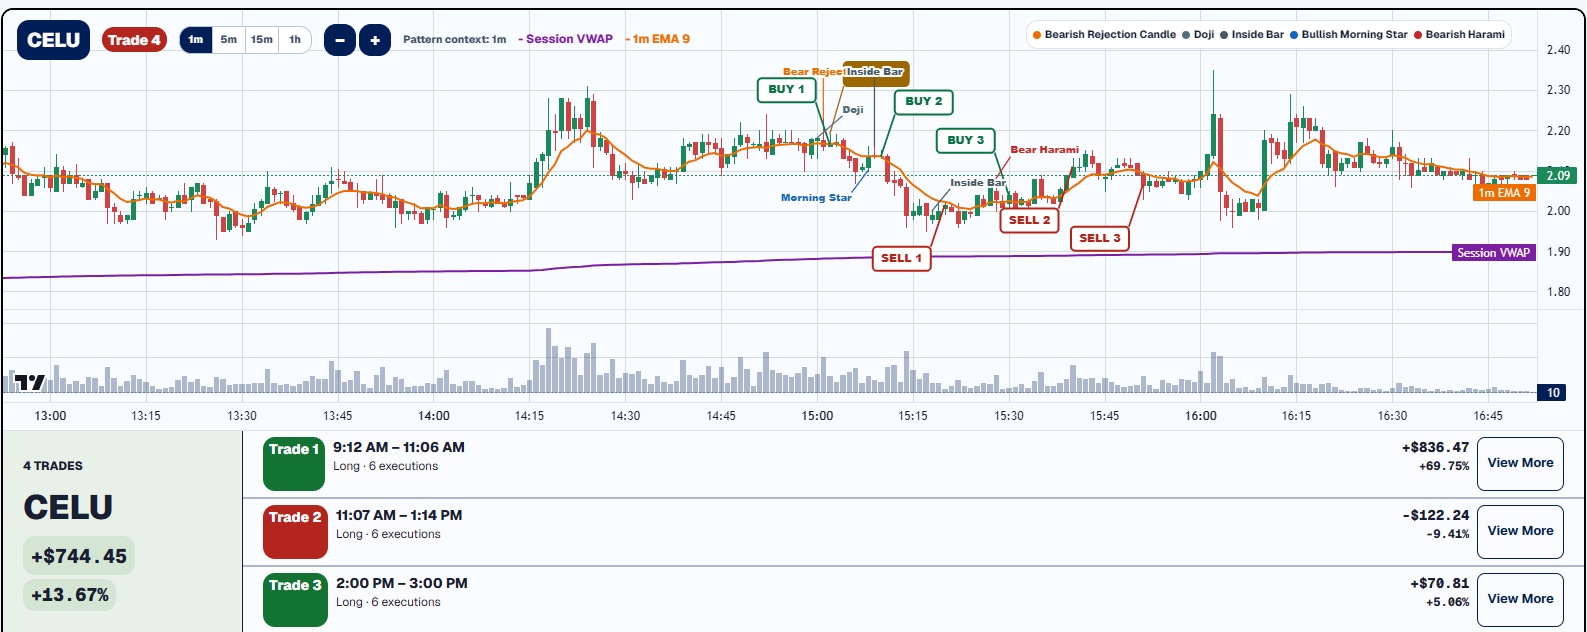
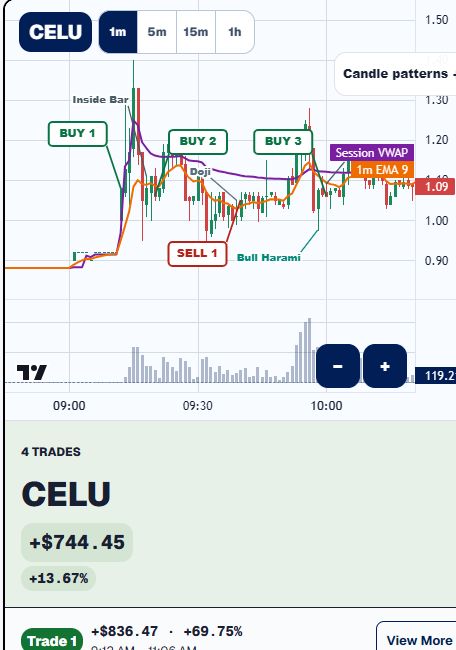
Trade Analytics shows you which results and completed trades deserve a closer look. Trade Analyzer puts those trades back into market context so you can study what happened around your decisions.
Trade Analytics FAQ
Questions you may want answers to.
Open a question to learn how TradersLink turns completed trades into performance views you can investigate.
What is trade analytics?
Trade analytics is the process of reviewing completed trading data to understand how different parts of trading relate to performance. Instead of looking only at total profit and loss, traders can examine entry time, ticker, price range, position size, holding time, win rate, expectancy, profit factor and the individual trades behind those results.
What trading metrics should I track?
Useful trading metrics include Net P/L, win rate, profit factor, expectancy, average win, average loss, completed-trade count and average P/L per trade. The most useful analysis usually comes from combining those metrics with the conditions behind the trades, such as when they were entered, the ticker, position size and holding time.
Can I analyze my trades by ticker or entry time?
Yes. TradersLink can organize completed trades by ticker, entry time, exit time, day of week, trading session, holding time, position size, entry price and other recorded trade characteristics. Trade Explorer can then open the individual trades behind those summarized results.
Can trade analytics help identify trading patterns?
Trade analytics can surface repeated differences in recorded results. A trader may find that particular entry times, price ranges, holding periods, tickers or position sizes produced stronger or weaker outcomes, then inspect the underlying trades instead of relying only on the summary.
Is TradersLink useful for small-cap traders?
Yes. TradersLink is built with active small-cap trading in mind. Entry-price ranges, ticker results, timing, position size, holding time, executions and trade-level analysis help traders study how their own decisions change across the fast-moving stocks they trade.
Can I compare different groups of trades?
Yes. Compare Trades places two to four selected groups of completed trades side by side. Traders can compare periods, tickers, directions, results, trade types, entry times, holding times, position sizes and entry-price ranges using P/L, win rate, profit factor, expectancy, average P/L, return on entry value and average holding time.
How do completed trades reach Analytics?
Confirmed completed trades entered through the Daily Trade Tracker, Quick Trade Entry or supported trade imports feed the same TradersLink trading journal. Analytics organizes those completed trades without changing the recorded executions.
Your completed trades already contain the data.
The next step is turning it into something useful. Track your trades, study your performance, investigate the patterns behind your results and keep every conclusion connected to the trades that produced it.
Sign up freeNo credit card required.